2012-13 Scholastic Report Highlights
Of the 20 students who shared their report cards:
- 85% improved their reading level
- 50% improved their listening/speaking skills
- 45% improved their science skills
11/12 Scholastic Report Cards, 1st & 2nd Trimester:
Of the 20 students sharing report cards:
- 65% students improved their Reading Level
- 25% students improved in Writing
- 15% improved in Visual and Performing Arts
2010-11
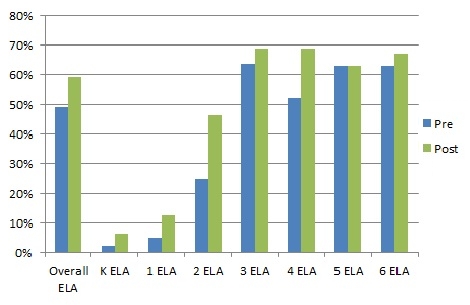
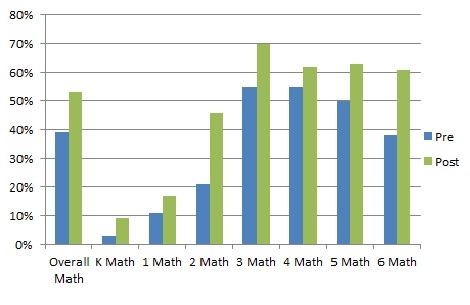
The average student increased an average of 14% in Math and 10% in Language Arts. Second graders had the highest overall averages, however, improving, on average, 24% in Math and 21% in Language Arts.
Of the 14 students sharing report cards:
- 43% of students improved in Reading
- 50% students improved in Listening and Speaking
- 57% students improved in Visual and Performing Arts
2009-10
The average student increased an average of 13% in English Language Arts and 6% in Math.
The most marked overall improvement was 1st and 2nd grade Language arts, with a 40% improvement.
One student increased 70% in English Language Arts and 40% in Math!
Of 27 students sharing report cards:
- 66% of students improved in Writing
- 59% improved in Reading Level
- 59% improved in Listening/Speaking
- 57% improved in Health
- 48% improved in Math
- 45% improved in History
- 41% improved in Science
Mean Pre & Post Test Scores
Pomona Hope After School Program 2010-2011
English/Language Arts (E/LA), By Scholastic Grade Level
Mean Pre & Post Test Scores
Pomona Hope After School Program 2010-2011
Mathematics, By Scholastic Grade Level
Mean Pre & Post Test Scores
Pomona Hope After School Program 2009-2010
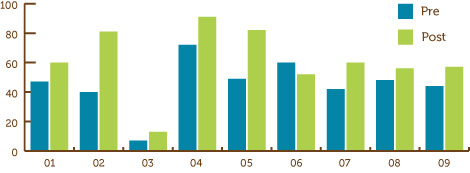
English/Language Arts (19 Students, Grades 1-10)
English Language Arts — Pre / Post / Average Improvement
01. Overall — 47% / 60% / 13%
02. 1st/ 2nd Gr Test Language Arts — 40% / 81% / 41%
03. 1st/2nd Grade Reading Proficiency — 7% / 13% / 6%
04. Word Analysis/Text Structures — 72% / 91% / 19%
05. Vocabulary — 49% / 82% / 33%
06. Reading Comprehension — 60% / 52% / -8
07. Understand Lit./Lit. Response — 42% / 60% / 18%
08. Language Conventions — 48% / 56% / 8%
09. Writing Strategies — 44% / 57% / 13%
Mean Pre & Post Test Scores
Pomona Hope After School Program 2009-2010
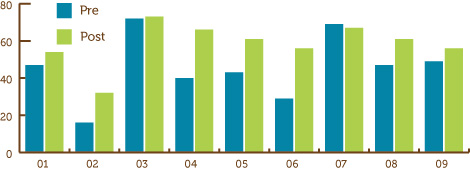
Mathematics (16 Students, Grades 1-9)
Math — Pre / Post / Average Improvement
Overall — 47% / 54% / 7%
1st/2nd Grade Test — 16% / 32% / 16%
Number Sense — 72% / 73% / 1%
Operations — 40% / 66% / 26%
Fractions & Decimals — 43% / 61% / 18%
Algebra & Functions — 29% / 45% / 16%
Measurement & Geometry — 69% / 67% / -2%
Geometry — 47% / 61% / 14%
Statistics & Probability — 49% / 56% / 7%
Report Card Analysis
Pomona Hope After School Program 2009-2010
27 Students brought in Report Cards Multiple Times
Percent Showing Improvement — Subject
59% — Reading
59% — Reading Level
66% — Writing
59% — Listening/Speaking
57% — Health
34% — PE
48% — Math
45% — History
41% — Science
27% — Technology
Mean Pre and Post Test Scores
Pomona Hope After School Program 2008-2009
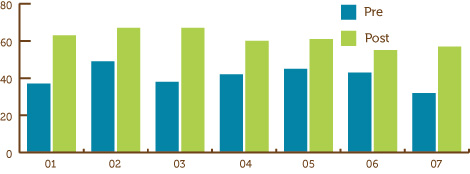
English/Language Arts (10 students Grades 2 – 6)
English Language Arts — Pre / Post / Improvement
Overall — 37% / 63% / 26%
Word Analysis/Text Structures — 49% / 67% / 18%
Vocabulary — 38% / 67% / 29%
Reading Comprehension — 42% / 60% / 18%
Understand Lit./Lit. Response — 45% / 61% / 16%
Language Conventions — 43% / 55% / 12%
Writing Strategies — 32% / 57% / 25%
Mean Pre and Post Test Scores
Pomona Hope After School Program 2008-2009
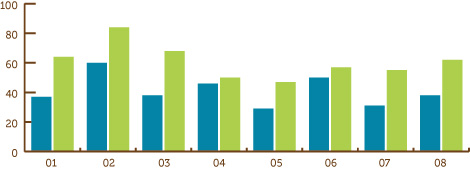
Mathematics (16 students Grades 2 – 6)
Math — Pre / Post / Improvement
Overall — 37% / 64% / 27%
Number Sense — 60% / 84% / 24%
Operations — 38% / 68% / 30%
Fractions & Decimals — 46% / 50% / 4%
Algebra & Functions — 29% / 47% / 18%
Measurement & Geometry — 50% / 57% / 7%
Geometry — 31% / 55% / 24%
Statistics & Probability — 38% / 62% / 24%
Report Card Analysis
Pomona Hope After School Program 2008-2009
14 Students brought in Report Cards Multiple Times
Percent Showing Improvement — Subject
43% — Reading
71% — Reading Level
57% — Writing
50% — Listening/Speaking
79% — Math
Volunteer Feedback Summary
Pomona Hope After School Program 2008-2009
- The average volunteer comes twice a week and has been volunteering 1 school year.
- They feel highly valued.
- They feel the students know the routine and the rules.
- Although most agree they have seen academic improvement, and emotional growth in the students, these ranked lowest. (3.9 and 3.7 on a scale of 1-5)

